Instrument – Chapter 9 – Aviation Weather Services
Quiz Summary
0 of 49 questions completed
Questions:
Information
You have already completed the quiz before. Hence you can not start it again.
Quiz is loading…
You must sign in or sign up to start the quiz.
You must first complete the following:
Results
Results
0 of 49 questions answered correctly
Your time:
Time has elapsed
You have reached 0 of 0 point(s), (0)
Earned Point(s): 0 of 0, (0)
0 Essay(s) Pending (Possible Point(s): 0)
Categories
- Not categorized 0%
- 1
- 2
- 3
- 4
- 5
- 6
- 7
- 8
- 9
- 10
- 11
- 12
- 13
- 14
- 15
- 16
- 17
- 18
- 19
- 20
- 21
- 22
- 23
- 24
- 25
- 26
- 27
- 28
- 29
- 30
- 31
- 32
- 33
- 34
- 35
- 36
- 37
- 38
- 39
- 40
- 41
- 42
- 43
- 44
- 45
- 46
- 47
- 48
- 49
- Current
- Review
- Answered
- Incorrect
-
Question 1 of 49
1. Question
AIRMETs are issued on a scheduled basis every
CorrectIncorrect -
Question 2 of 49
2. Question
The Hazardous lnflight Weather Advisory Service (HIWAS) is a continuous broadcast over selected VORs of
CorrectIncorrect -
Question 3 of 49
3. Question
Pilots of IFR flights seeking ATC in-flight weather avoidance assistance should keep in mind that
CorrectIncorrect -
Question 4 of 49
4. Question
SIGMETs are issued as a warning of weather conditions potentially hazardous
CorrectIncorrect -
Question 5 of 49
5. Question
SIGMETs are issued as a warning of weather conditions potentially hazardous
CorrectIncorrect -
Question 6 of 49
6. Question
The reporting station originating this Aviation Routine Weather Report has a field elevation of 620 feet. If the reported sky cover is one continuous layer, what is its thickness (tops of OVC are reported at 6,500 feet)?
METAR KMDW 121856Z AUTO 32005KT 1 1/2SM +RA BR OVC007 17/16 A2980
CorrectIncorrect -
Question 7 of 49
7. Question
The station originating the following weather report has a field elevation of 1,300 feet MSL. From the bottom of the overcast cloud layer, what is its thickness (tops of OVC are reported at 3,800 feet)?
SPECI KOKC 2228Z 28024G36KT 3/4SM BKN008 OVC020 28/23 A3000
CorrectIncorrect -
Question 8 of 49
8. Question
Interpret the remarks section of METAR surface report for KBNA.
METAR KBNA 211250Z 33018KT 290V260 1/2SM R31/2700FT +SN BLSNFG VV008 OO/M03 A2991 RMK RAE42SNB42
CorrectIncorrect -
Question 9 of 49
9. Question
A ceiling is defined as the height of the
CorrectIncorrect -
Question 10 of 49
10. Question
What significant sky condition is reported in this METAR observation?
METAR KBNA 1250Z 33018KT 290V360 1/2SM R31/2700FT +SN BLSNFG VV008 OO/M03 A2991 RMK RERAE42SNB42
CorrectIncorrect -
Question 11 of 49
11. Question
Interpret this PIREP.
MRB UA/OV MRB/TM 1430/FL 060/TP C182/SK BKN BL /WX RA/TB MDT.
CorrectIncorrect -
Question 12 of 49
12. Question
Which response most closely interprets the following PIREP?
UA/OV OKC 063064/TM 1522/FL080/TP C172/TA – 04 /WV245040/TB LGT/RM IN CLR.
CorrectIncorrect -
Question 13 of 49
13. Question
Use the TAF to determine the wind shear forecast.
TAF
KCVG 231051Z 231212 12012KT 4SM -RA BR OVC008 WS005/27050KT TEMPO 1719 1/2SM -RA FG
FM1930 09012KT 1SM-DZ BR VV003 BECMG 2021 5SM HZ=
CorrectIncorrect -
Question 14 of 49
14. Question
What is the forecast wind at 1800Z in the following TAF?
KMEM 091740Z 1818 OOOOOKT 1/2SM RAFG OVC005=
CorrectIncorrect -
Question 15 of 49
15. Question
When the visibility is greater than 6 SM on a TAF it is
CorrectIncorrect -
Question 16 of 49
16. Question
Which weather product is a concise statement of the expected weather for an airport’s runway complex?
CorrectIncorrect -
Question 17 of 49
17. Question
A “VRB” wind entry in a Terminal Aerodrome Forecast (TAF) will be indicated when the wind is
CorrectIncorrect -
Question 18 of 49
18. Question
The body of a Terminal Aerodrome Forecast (TAF) covers a geographical proximity within a
CorrectIncorrect -
Question 19 of 49
19. Question
A station is forecasting wind and temperature aloft at FL 390 to be 300° at 200 knots; temperature -54°C. How would this data be encoded in the FB?
CorrectIncorrect -
Question 20 of 49
20. Question
How much colder than standard temperature is the forecast temperature at 9,000 feet, as indicated in the following excerpt from the Wind and Temperature Aloft Forecast?
FT 6000 9000
0737-04 1043-10
CorrectIncorrect -
Question 21 of 49
21. Question
What wind direction and speed is represented by the entry 9900+00 for 9,000 feet, on a Wind and Temperature Aloft Forecast (FB)?
CorrectIncorrect -
Question 22 of 49
22. Question
When is the temperature at one of the forecast altitudes omitted at a specific location or station in the Wind and Temperature Aloft Forecast (FB)?
CorrectIncorrect -
Question 23 of 49
23. Question
Refer to figure 2 below. What approximate wind direction, speed, and temperature (relative to ISA) should a pilot expect when planning for a flight over ALB at FL 270?
 CorrectIncorrect
 -
Question 24 of 49
24. Question
Refer to figure 2 below. What approximate wind direction, speed, and temperature (relative to ISA) should a pilot expect when planning for a flight over PSB at FL 270?
 CorrectIncorrect
 -
Question 25 of 49
25. Question
Refer to figure 2 below. What approximate wind direction, speed, and temperature (relative to ISA) should a pilot expect when planning for a flight over EMI at FL 270?
 CorrectIncorrect
 -
Question 26 of 49
26. Question
When is the wind group at one of the forecast altitudes omitted at a specific location or station in the Wind and Temperature Aloft Forecast (FB)? When the wind
CorrectIncorrect -
Question 27 of 49
27. Question
Which values are used for winds aloft forecasts?
CorrectIncorrect -
Question 28 of 49
28. Question
Decode the excerpt from the Winds and Temperature Aloft Forecast (FB) for OKC at 39,000 feet.
FT 3000 9000 12000 24000 39000
OKC 9900 2018+00 2130-06 2361-30 830558
CorrectIncorrect -
Question 29 of 49
29. Question
A prognostic chart depicts the conditions
CorrectIncorrect -
Question 30 of 49
30. Question
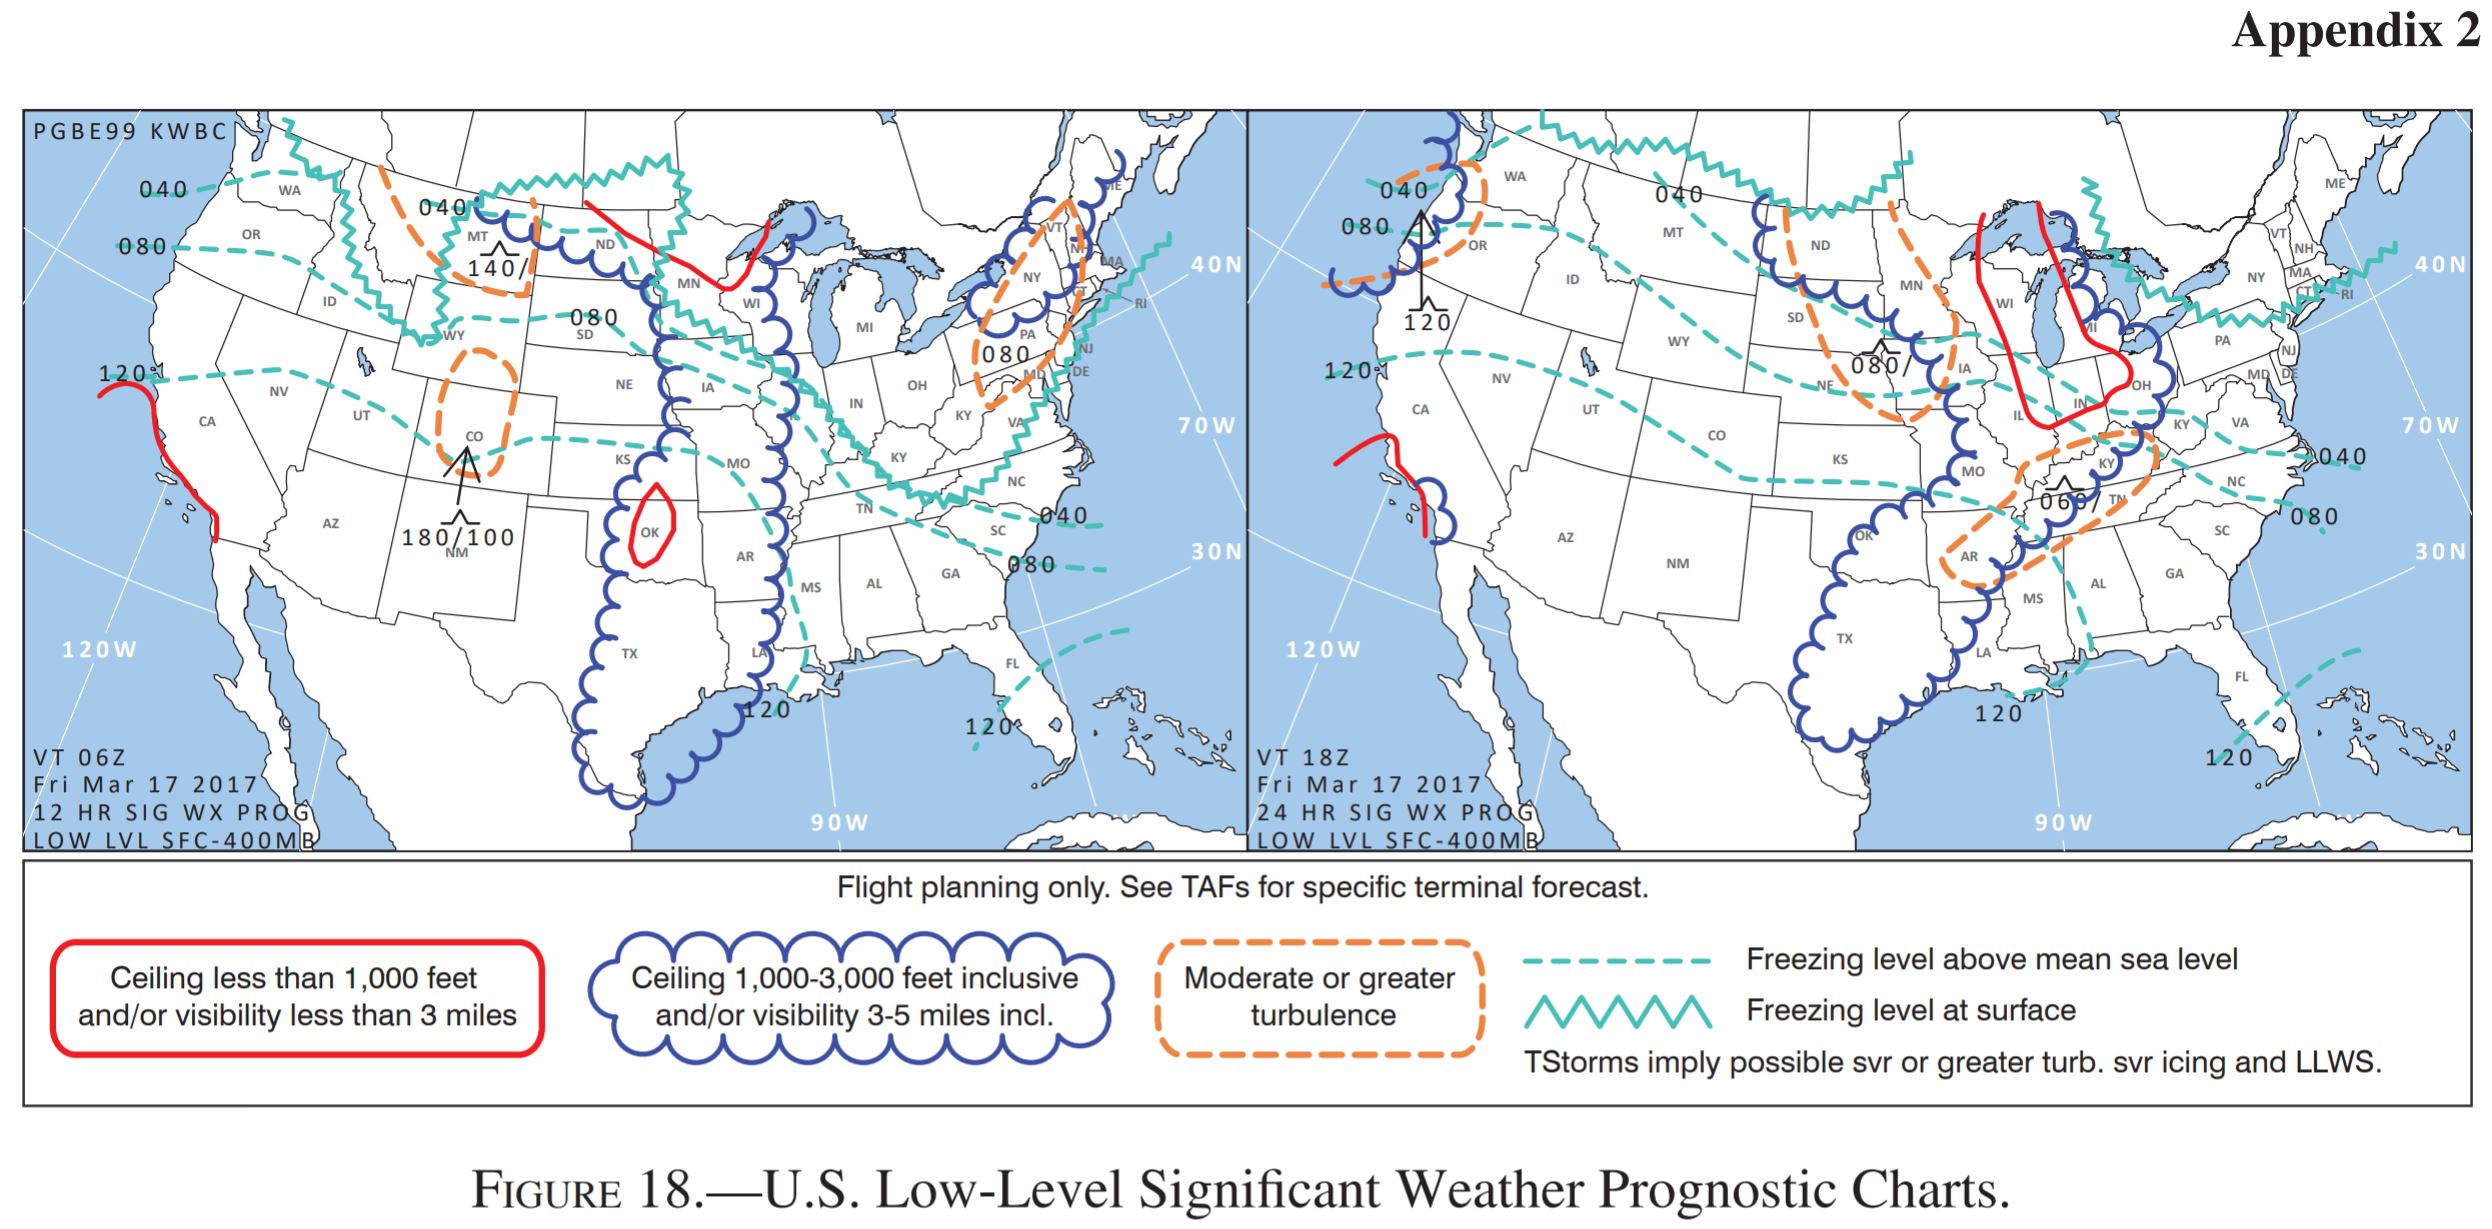
Refer to figure 18 below. The U.S. Low-Level Significant Weather Prognostic Chart at 06Z indicates that central Colorado and southeastern Wyoming can expect
 CorrectIncorrect
 -
Question 31 of 49
31. Question
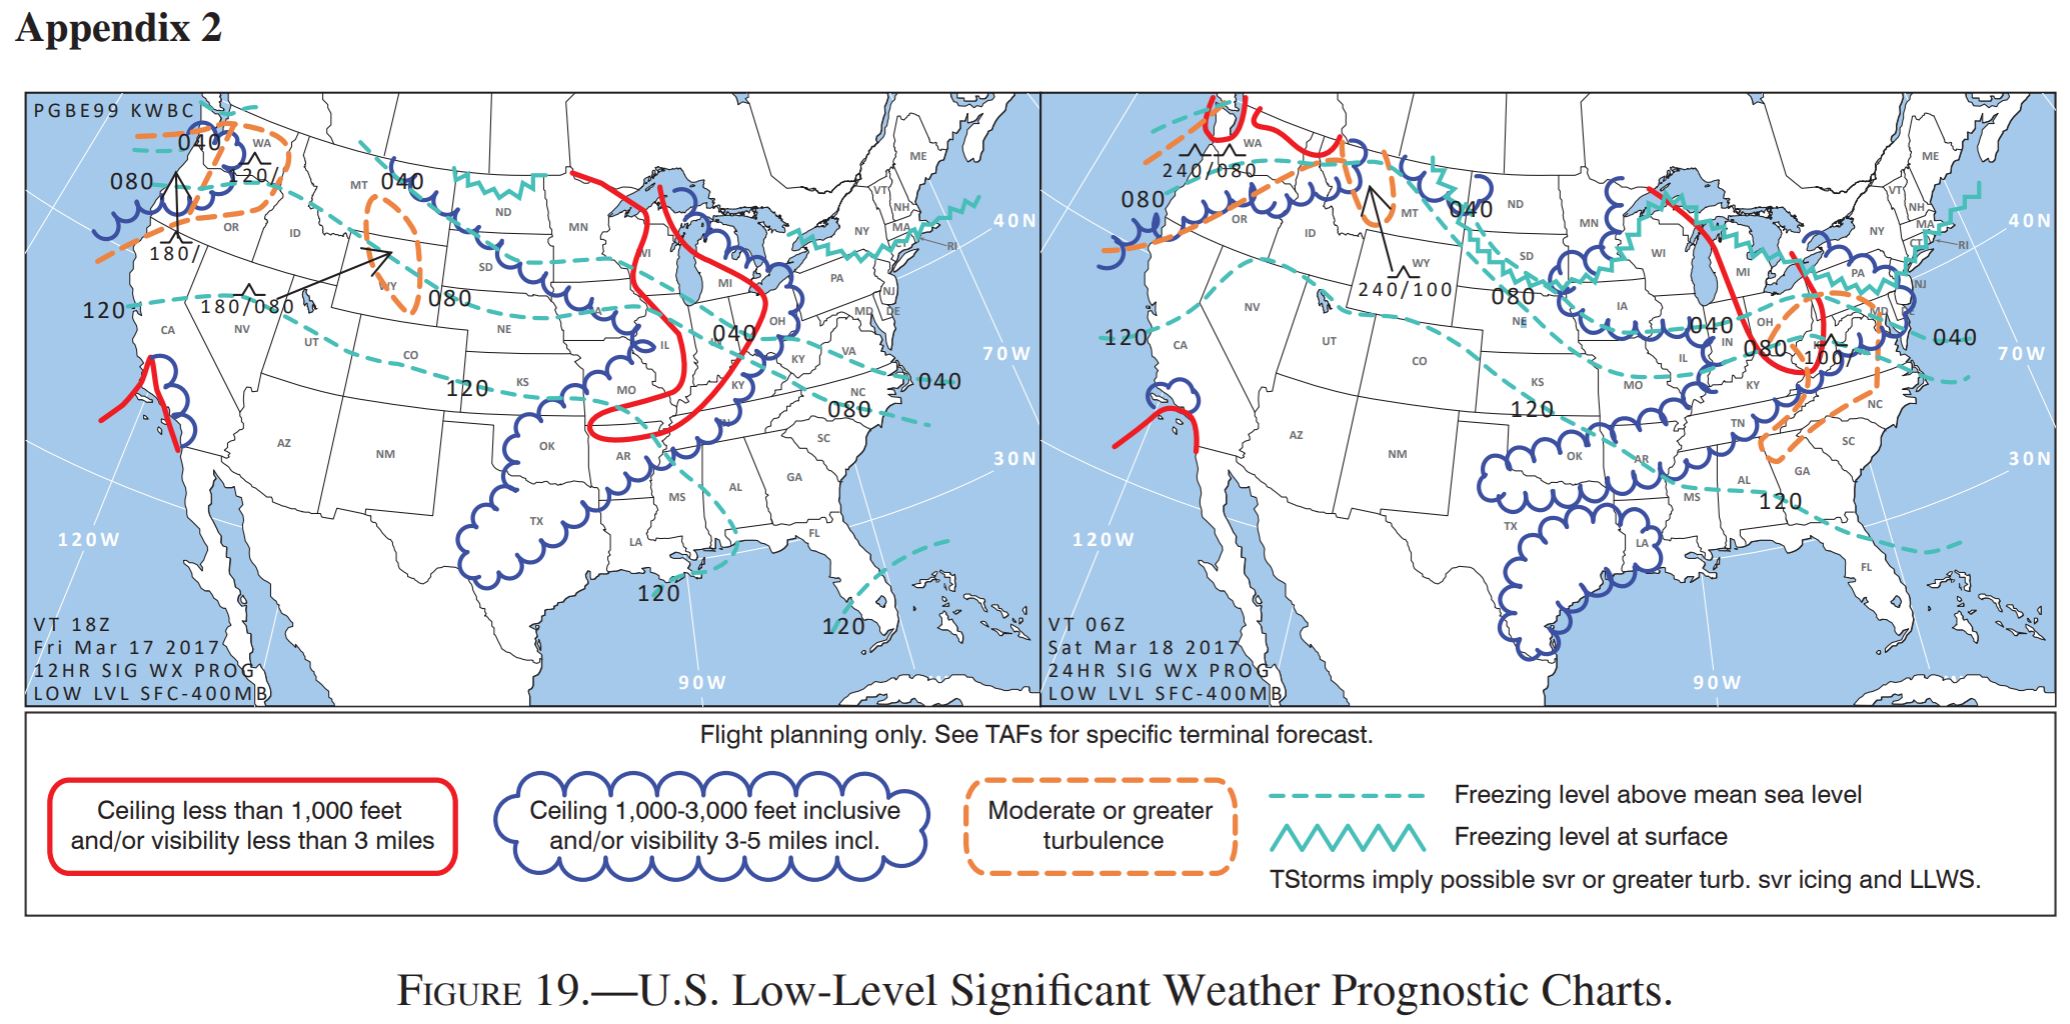
Refer to figure 19 below. The 24-Hour Low-Level Significant Weather Prognostic Chart at 06Z indicates that Ohio will likely experience

 CorrectIncorrect
 -
Question 32 of 49
32. Question
The Low-Level Significant Weather Prognostic Chart depicts weather conditions
CorrectIncorrect -
Question 33 of 49
33. Question
Which meteorological conditions are depicted by a prognostic chart?
CorrectIncorrect -
Question 34 of 49
34. Question
A pilot planning to depart at 1100Z on an IFR flight is particularly concerned about the hazard of icing. What sources reflect the most accurate information on icing conditions (current and forecast) at the time of departure?
CorrectIncorrect -
Question 35 of 49
35. Question
What determines how icing is reported on a PIREP?
CorrectIncorrect -
Question 36 of 49
36. Question
What conclusion(s) can be drawn from a 500-millibar Constant Pressure Chart for a planned flight at FL 180?
CorrectIncorrect -
Question 37 of 49
37. Question
Which weather forecast describes prospects for an area coverage of both severe and general thunderstorms during the following 24 hours?
CorrectIncorrect -
Question 38 of 49
38. Question
The Surface Analysis Chart depicts
CorrectIncorrect -
Question 39 of 49
39. Question
What information is provided by a Convective Outlook (AC)?
CorrectIncorrect -
Question 40 of 49
40. Question
What does a Convective Outlook (AC) describe for a following 24-hr. period?
CorrectIncorrect -
Question 41 of 49
41. Question
If you encounter in-flight icing and ATC asks you to report your conditions, what are the official reportable icing values that you are expected to use?
CorrectIncorrect -
Question 42 of 49
42. Question
When are severe weather watch bulletins (WW) issued?
CorrectIncorrect -
Question 43 of 49
43. Question
What flight planning information can a pilot derive from constant pressure charts?
CorrectIncorrect -
Question 44 of 49
44. Question
Refer to figure 20 below. What is the maximum wind velocity forecast in the jet stream shown on the High Level Significant Weather Prognostic Chart over Eastern Canada?
 CorrectIncorrect
 -
Question 45 of 49
45. Question
Refer to figure 20 below. What is the height of the center of the low tropopause height over eastern Canada?
 CorrectIncorrect
 -
Question 46 of 49
46. Question
Refer to figure 7 below. What weather conditions are predicted within area 3?
 CorrectIncorrect
 -
Question 47 of 49
47. Question
Refer to figure 7 below. What weather conditions are depicted within area 7?
 CorrectIncorrect
 -
Question 48 of 49
48. Question
Refer to figure 7 below. The U.S. HIGH-LEVEL SIGNIFICANT WEATHER PROG, area 8, represents the
 CorrectIncorrect
 -
Question 49 of 49
49. Question
Refer to figure 7 below. What type of weather can be expected in the red scalloped area near area 9?
 CorrectIncorrect